Articles of Interest
Overcoming the Denominator Effect with Liquid Public Assets
Denominator Effect
Like a seesaw in a park, the denominator effect may require a mere market push off the bottom to correct itself. Children in the park enjoy the suspense, but asset owners have policy obligations and feel discomfort when evaluating how to address the Denominator Effect. The effect could be transient, like Eeyore’s “here today, gone tomorrow” dismissal, but what if it persists and causes divisiveness amongst plan sponsors and their trustees?
Pensions, after all, are legal entities that have fiduciary obligations. The funding, rebalancing or policy change questions the Denominator Effect poses are neither easy to discuss nor to reconcile, so it is good to explore ways to mitigate these potentially divisive problems.
Some larger pensions are implementing a total portfolio approach, one that examines the role each investment strategy plays in the portfolio. Risk and return characteristics are evaluated, but so too is liquidity, because the approach is dynamic, adapting to changes in capital markets.
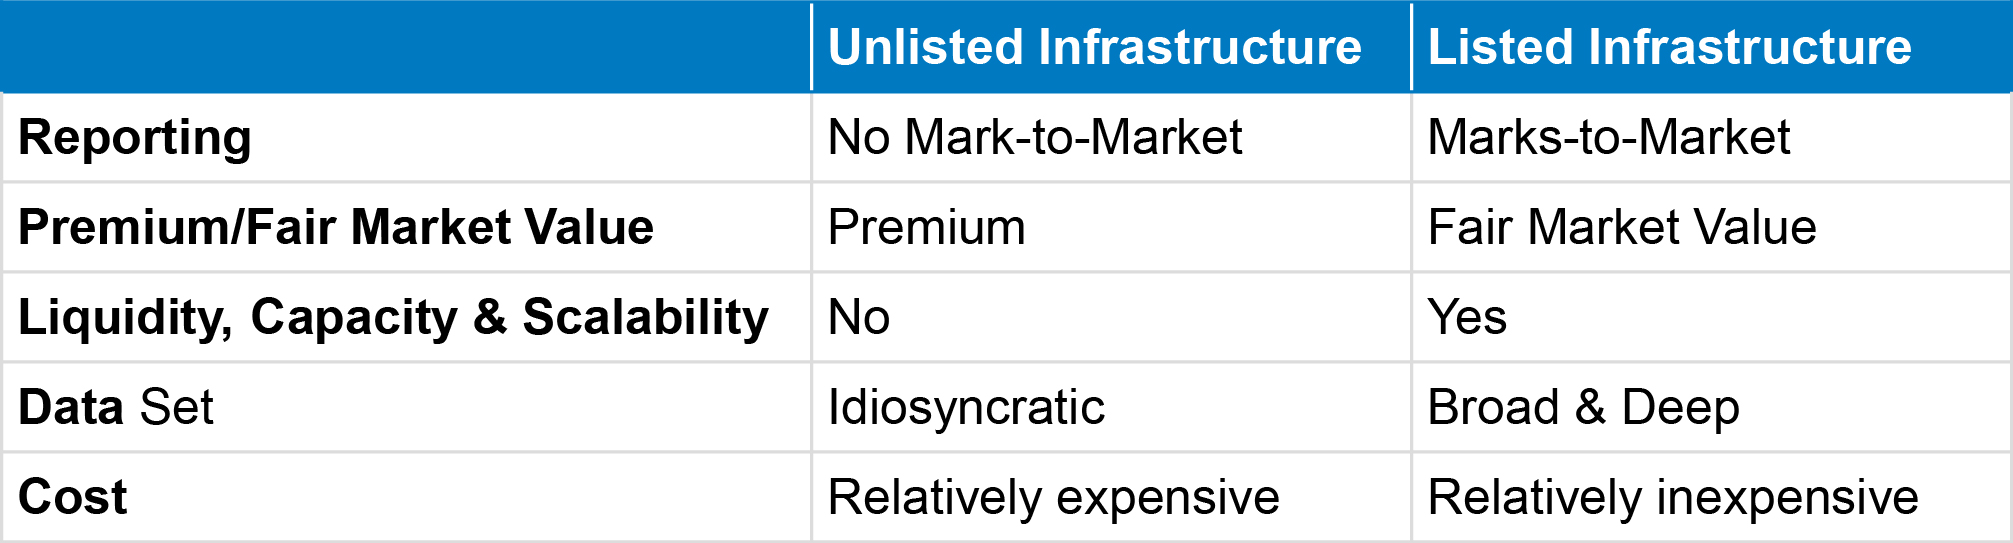
Most of the discussion about the Denominator Effect centres on the imbalance that occurs when listed asset valuations decline, distorting asset allocation models and potentially contravening policies. The numerator declines because public assets are priced at fair market value while unlisted, illiquid private assets in the denominator hover on the horizon, weightless, because they do not mark-to-market.
Part of the problem lies in the difference between the way listed and unlisted assets are priced, the former transparently in the market and the latter subjectively. Unlike the generally accepted accounting principles (GAAP) or the International Financial Reporting Standards (IFRS) used for reporting in public securities, which the market considers, there are valuation idiosyncrasies across private markets managers.
The real problem, however, is not their valuation, but their inherent illiquidity. When the denominator exceeds its acceptable range, illiquid private assets constrain a total portfolio approach.
An Ounce of Prevention
There are some key remedies to achieve an acceptable balance between public and private assets, but each is reactionary, after the fact:
- Do nothing, hoping the Effect is transient, rectified by a rebounding public market. The Credit Crisis, with its sharp “V” recovery, was a great example of how a market can rebound quickly. So, too, was the COVID rebound. In contrast, 2000-2002 was excruciating, testing everyone’s resolve and patience;
- Sell your most stable, prized and liquid unlisted assets to correct the imbalance. This may require queuing up alongside other investors to redeem from funds offering the most favourable exit terms or choosing to dispose of assets directly into the secondary market. If this is possible (remember the real estate funds which froze redemptions during the Credit Crisis), it may incur significant cost, both present and possibly future—in addition to delays in putting new capital to work. Private assets are often acquired at a premium, which institutions willingly pay because they covet the reporting stability from investments that do not mark-to-market. If these assets are sold in a secondary market at a possible discount, it creates friction. Does good plan governance condone buying at a premium yet selling at a discount? Could this limit access to future ‘vintages’ from the same provider, presenting yet another risk?;
- Increase funding to public assets to correct the imbalance. This introduces an additional stress on the plan sponsor, an unsavoury proposition for public plans and private plans alike.
Avoiding a problem is always better than solving one. Private investments in real assets like infrastructure and real estate or private assets in debt or equity provide great diversification to publicly-listed assets. It is possible to replicate similar risk and return profiles to unlisted assets using liquid public assets, lowering costs and using a rich data set to model risk.
Like Dickens’ Artful Dodger, savvy investors can allocate assets to these liquid exposures, avoiding the operational challenges illiquidity poses when the denominator effect is triggered.
Yes, there may be reporting variability, but these should be evaluated in a balanced manner. Liquid positions facilitate total portfolio management and may provide an opportunity to buy at a discount. Complementary allocations even out both sides of the ledger, providing flexibility and opportunity.
Capturing the diversification properties private assets provide in the numerator, through liquid facsimiles, may minimize the probability of the Denominator Effect’s occurrence. There are several benefits:
- Listed assets provide a robust data set to model risk and return more accurately. Unlisted assets are idiosyncratic, challenging due diligence;
- Listed assets provide liquidity and capacity whereas illiquid alternatives have constraints. Operationally, listed assets provide flexibility not possible in unlisted assets;
- Total cost of ownership for listed assets is fractional to the cost for unlisted assets. If accessing listed assets through an ETF, institutions may earn lending premium, further reducing the cost of ownership.
Real Assets
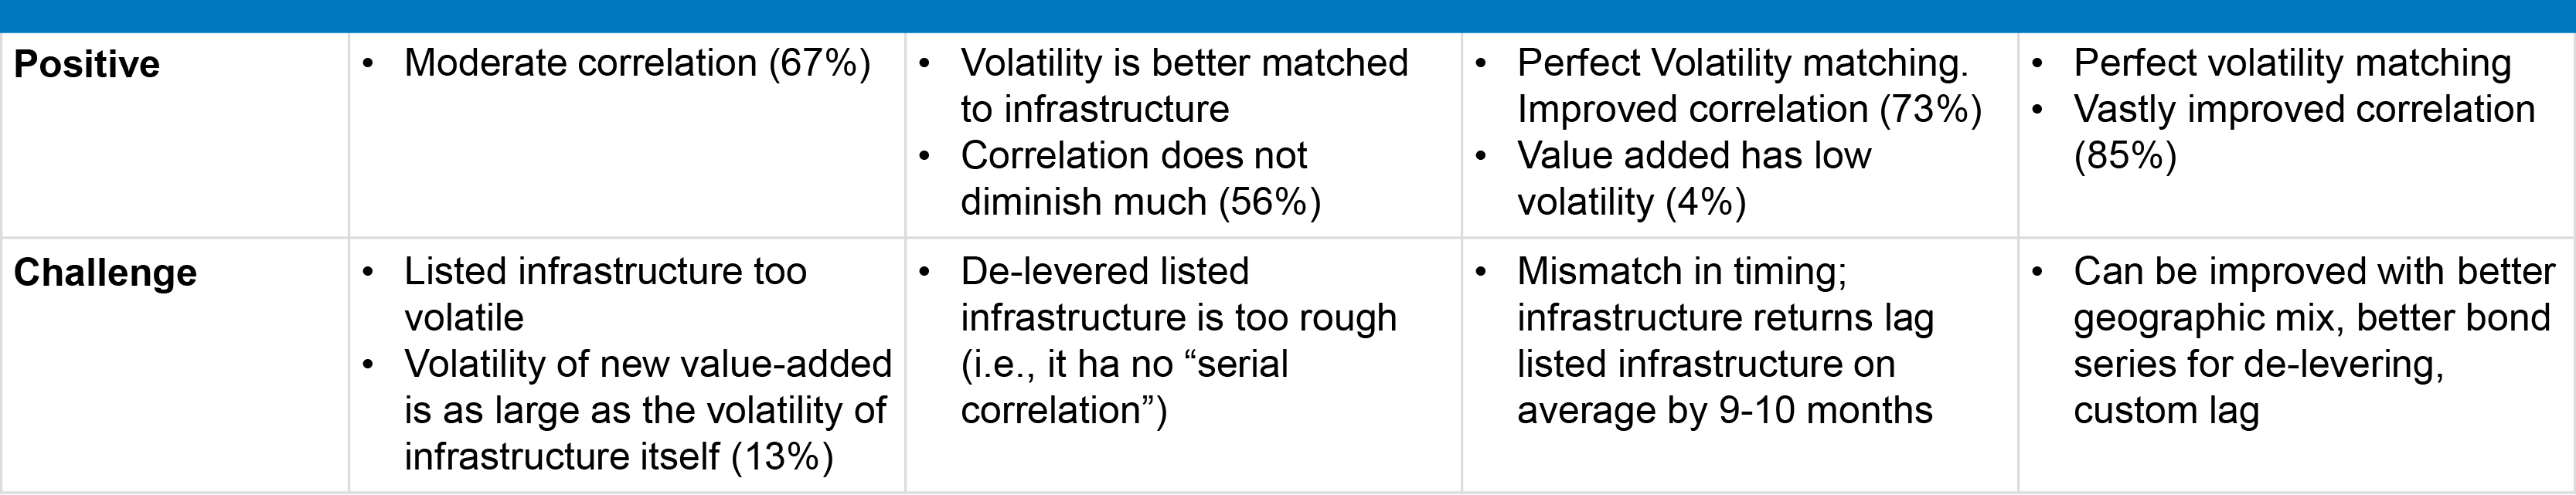
The differences between listed and unlisted infrastructure are much less dramatic when adjustments are made to account for leverage and reporting lags.
Listed infrastructure resembles unlisted infrastructure once you adjust for leverage, smoothing and lag
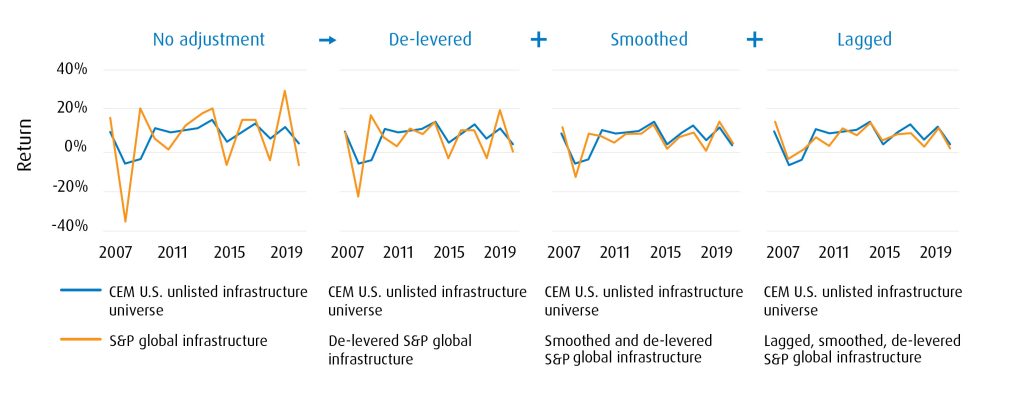
Source: CEM Benchmarking Inc. Returns are gross of fees.
Adjusting for key elements reveals there is very little difference in the long-term profiles of listed and unlisted infrastructure:
- Leverage – leverage is higher in unlisted assets than in listed assets;
- Data relevancy – new data, in isolation, may not be relevant (house price example);
- Reporting lags – market priced transparently daily/unlisted market priced idiosyncratically quarterly/annually
The assumed long-term preference for unlisted assets evaporates under scrutiny.
To be clear, the argument applies to pure-play listed infrastructure, which most closely resembles unlisted exposure. Publicly traded core or broad infrastructure do not have the same attributes and thus are not a suitable facsimile.1
Over the long-term, the two infrastructure plays almost overlay one another. Combining the two may strengthen the benefits infrastructure can bring to portfolio construction:
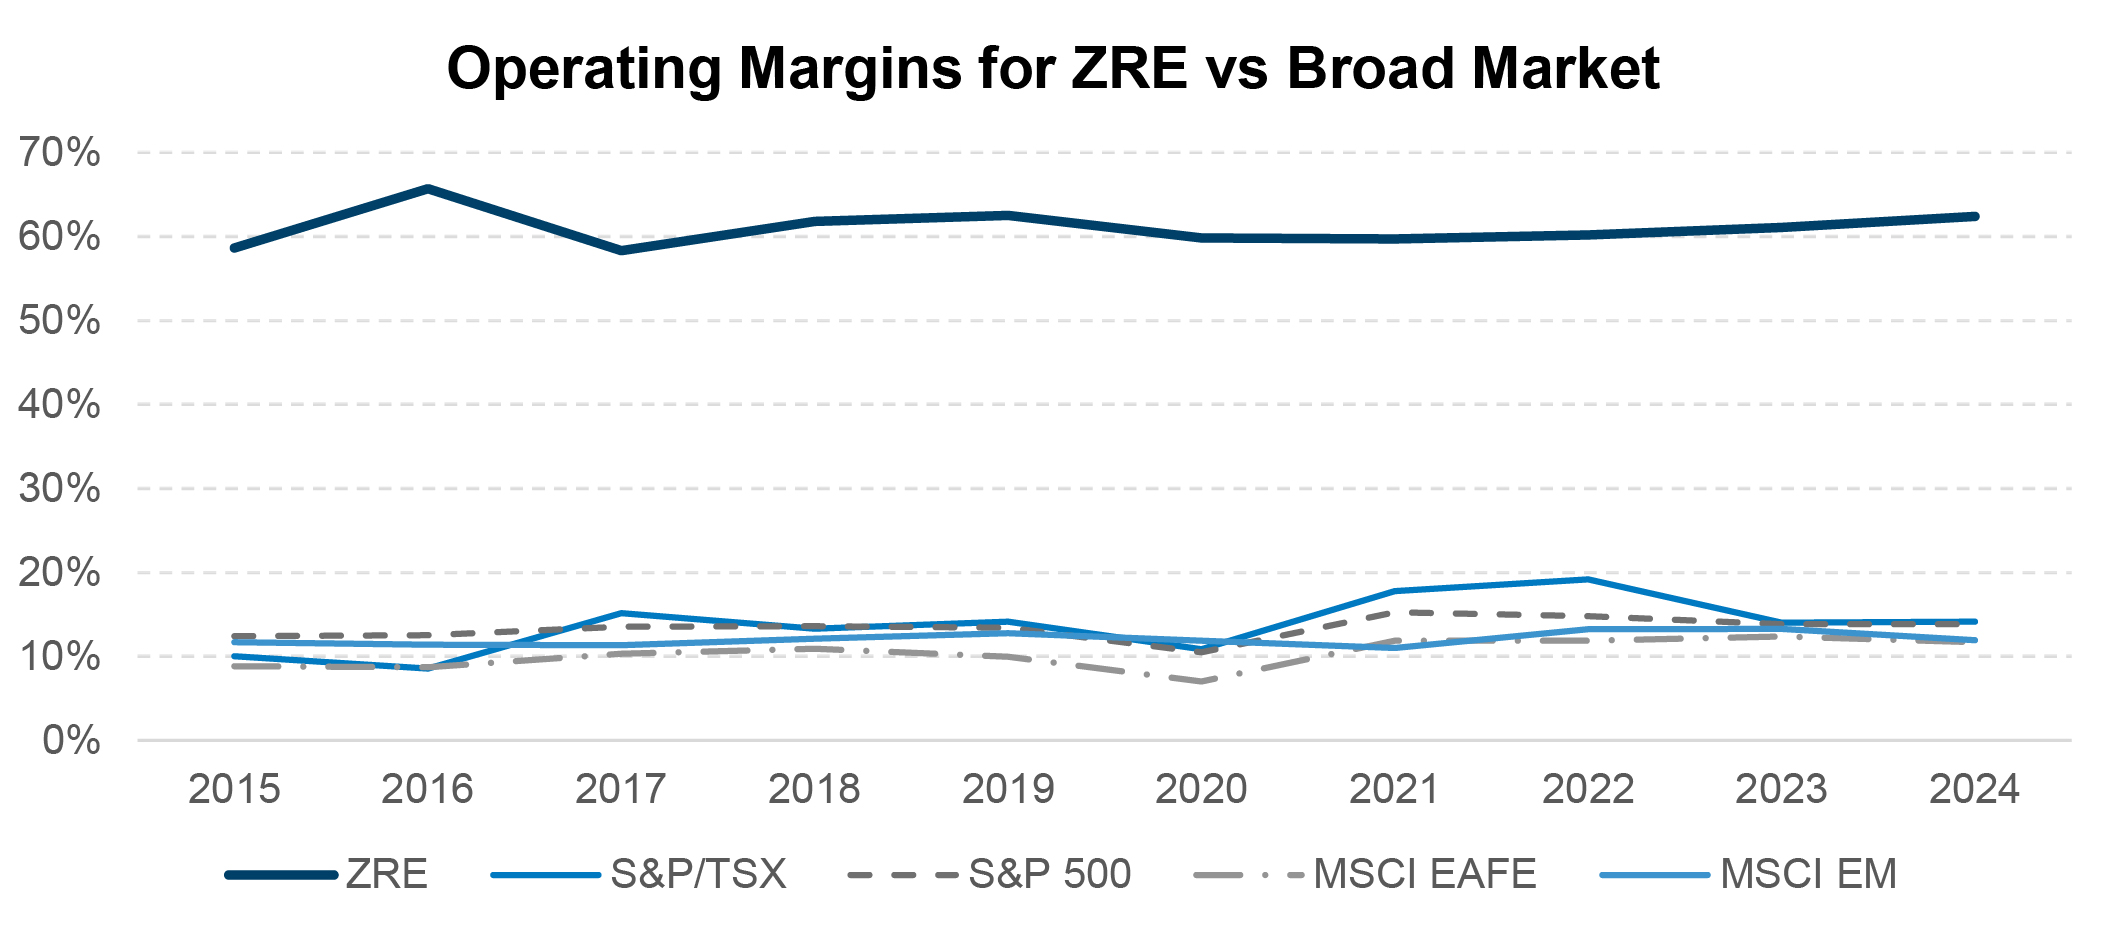
As the chart below reveals, listed pure-play infrastructure has appealingly high margins, akin to what institutional investors hope to reap in unlisted investments:
Global Infrastructure: Historically strong and consistent operating margins (2013 – 2024)
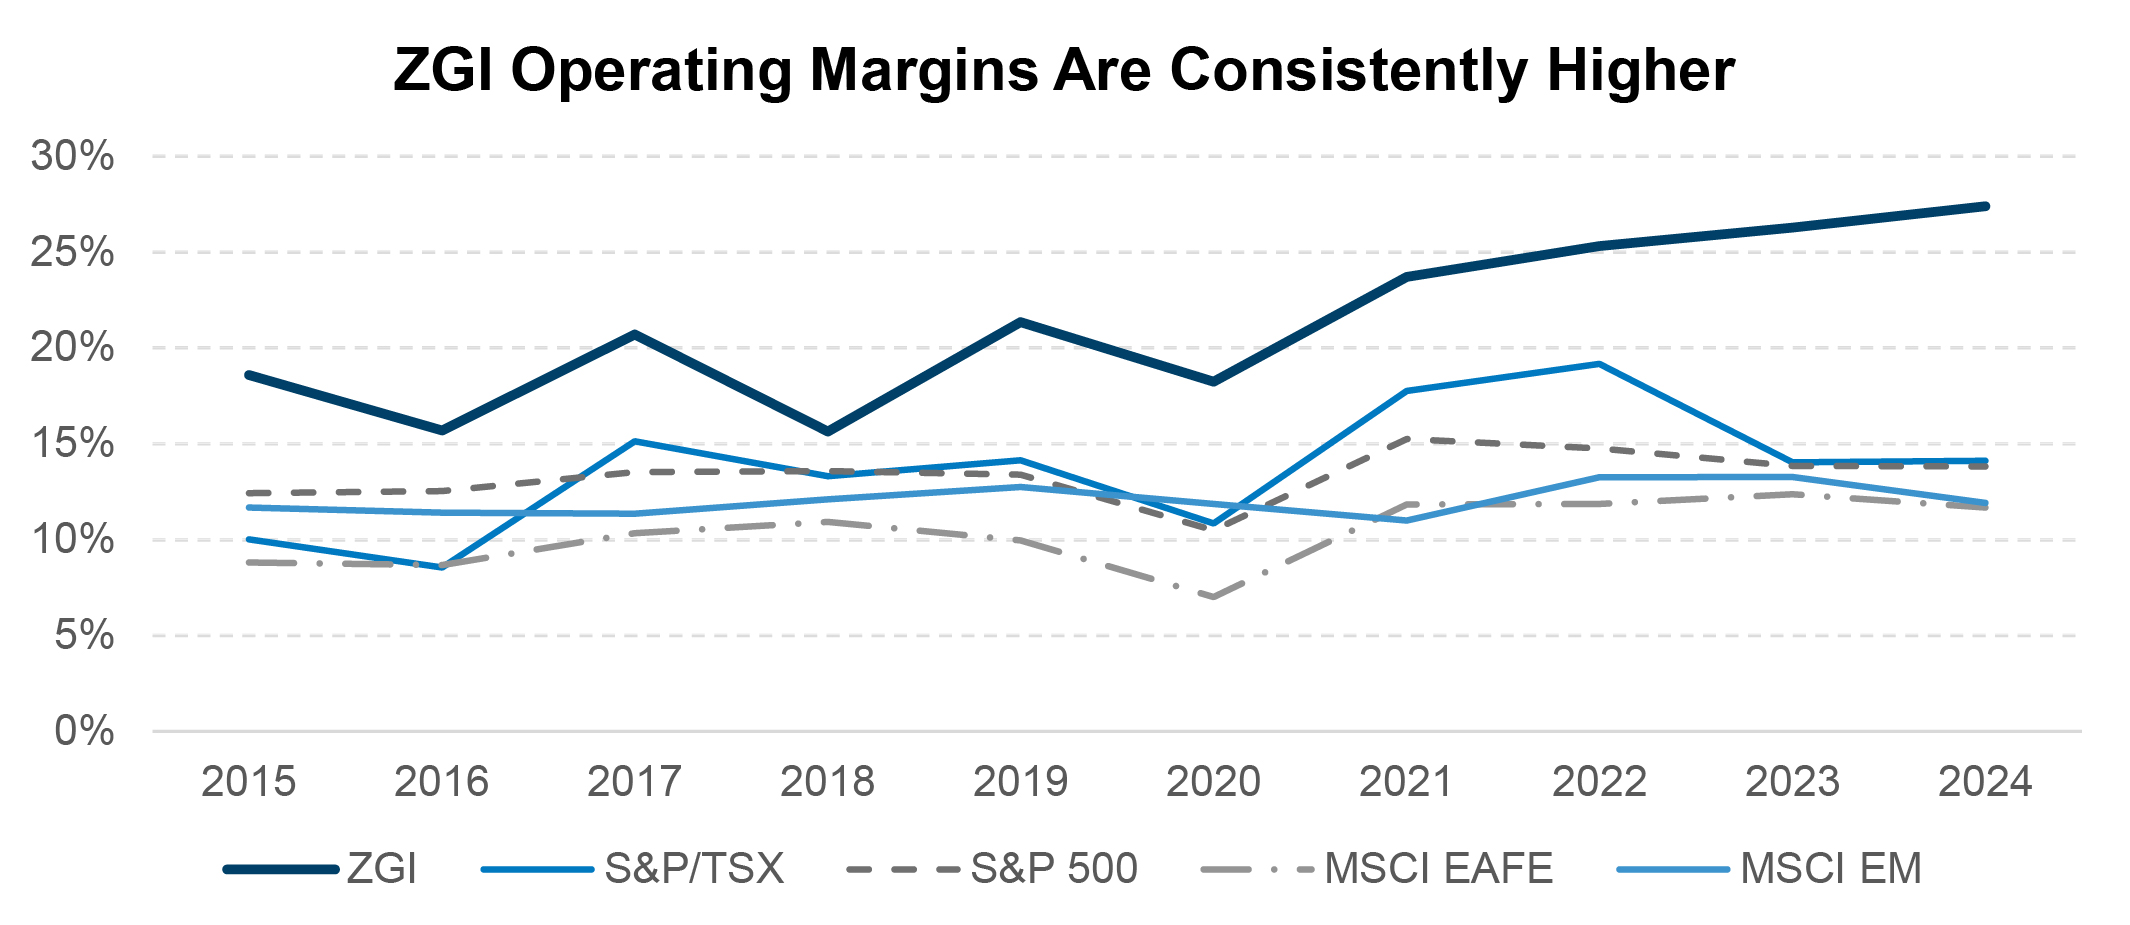
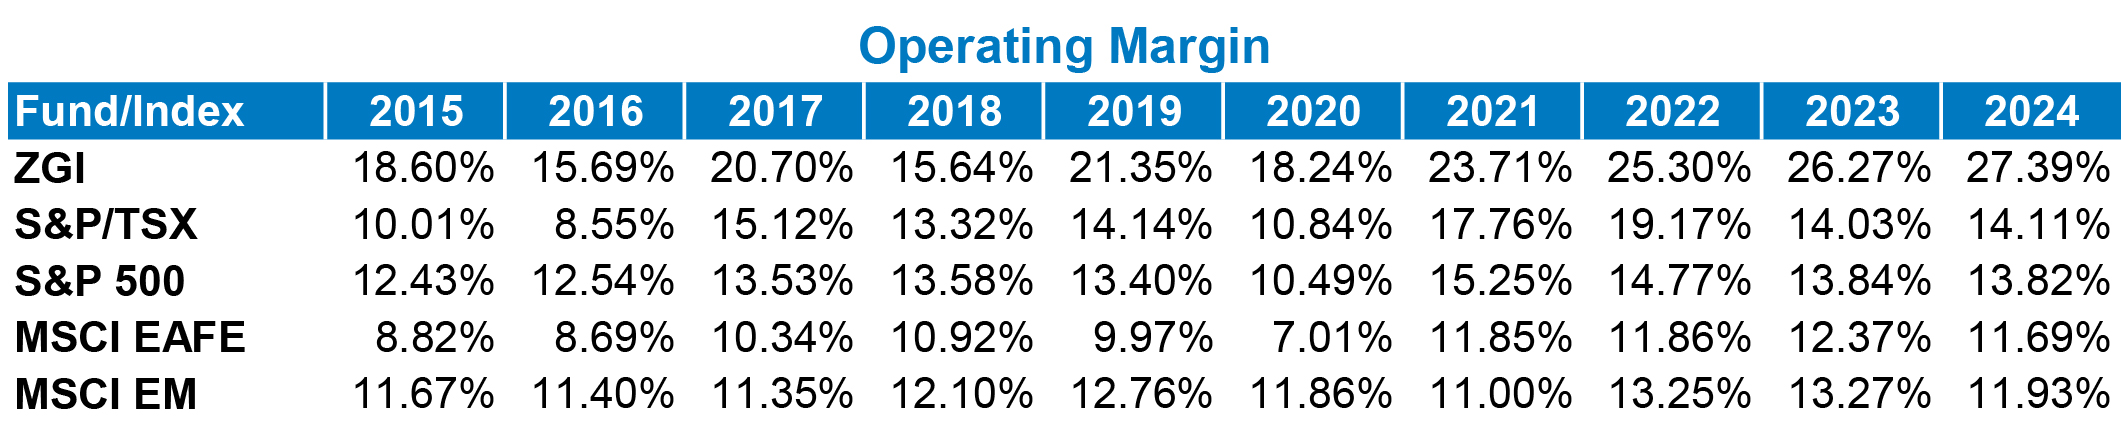
Source: BMO Global Asset Management, as of March 31, 2024. Returns are gross of fees.
Unlisted infrastructure is prized for its inflation buffering attributes, but similar properties are also achievable in listed equivalents:
Global Listed Infrastructure vs CPI+4% – returns to March 31, 2024
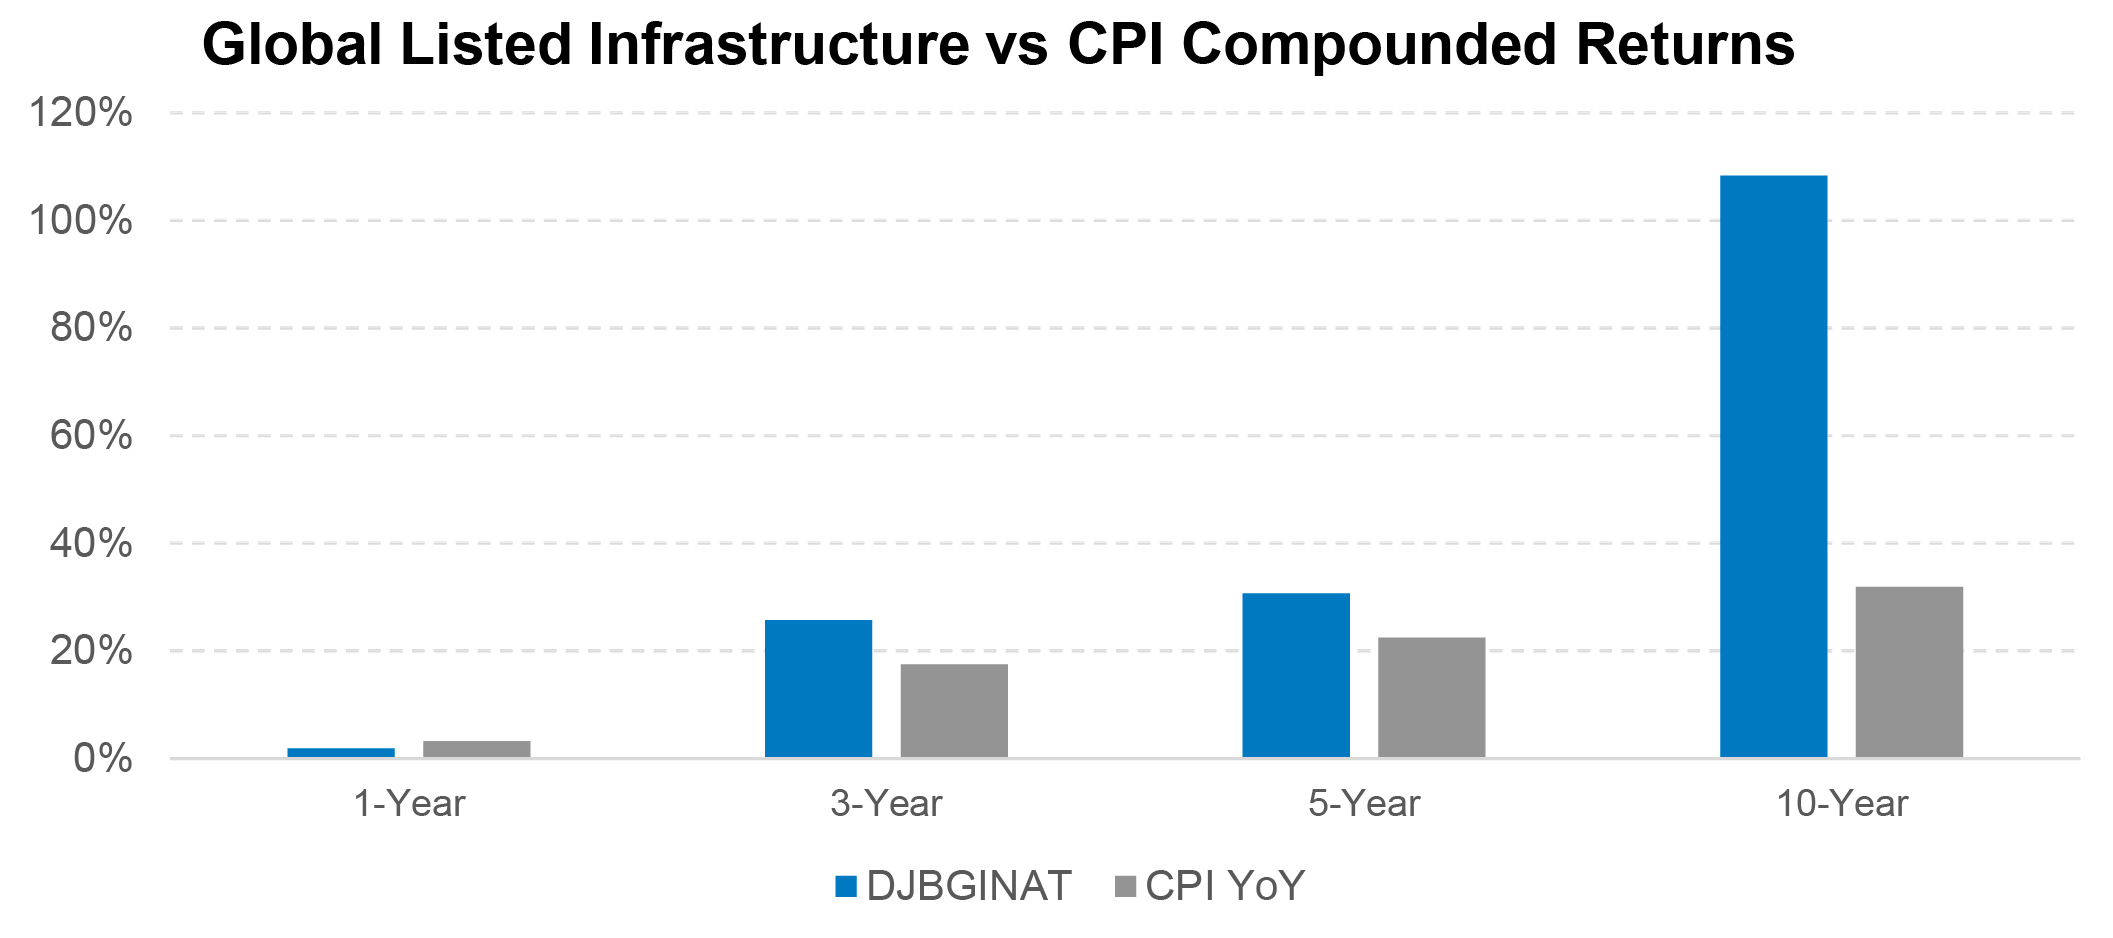
Source: BMO Global Asset Management, as of March 31, 2024. Returns are gross of fees.
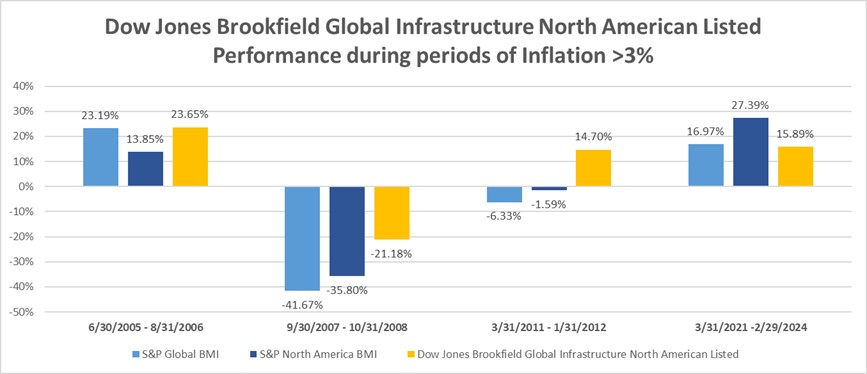
Dow Jones Brookfield Global Infrastructure North American Listed Performance during periods of Inflation >3%
Average Monthly Returns – Inflation > 3%
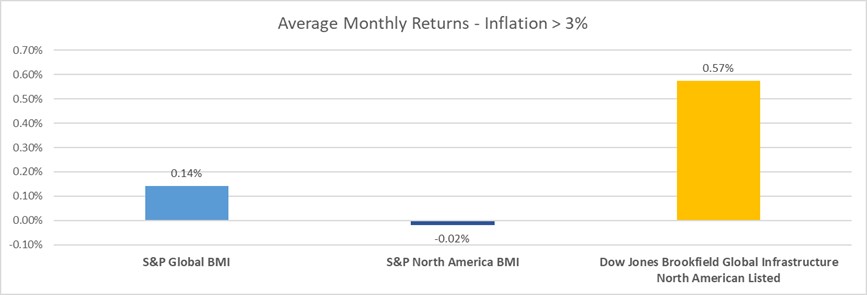
Source: S&P Dow Jones Indices. Returns are gross of fees. Data from December 31, 2022 to January 31, 2023. Index performance based on monthly total return in USD. Past performance is no guarantee of future results. Chart is provided for illustrative purposes and reflects hypothetical historical performance.
The same case can be made in real estate, another asset where liquidity is extremely limited. Listed real estate provides the same attractive margins institutional investors seek in unlisted assets but does so with a much different liquidity profile.
Source: Bloomberg. Data from March 31, 2024.
Two-way liquidity is extremely valuable in real assets, providing more control, a possibility to enter at a discount and to rebalance as required to maintain asset mix targets.
Private Debt
Similarly, it is possible to construct a complementary model using non-core public fixed income securities to provide some of the diversification properties associated with private debt. There are several key advantages:
- Public securities provide a broad and deep data set to more accurately model risk and return. Private debt exposure is highly idiosyncratic, demanding greater due diligence;
- Institutions can manage credit quality and liquidity using public debt.
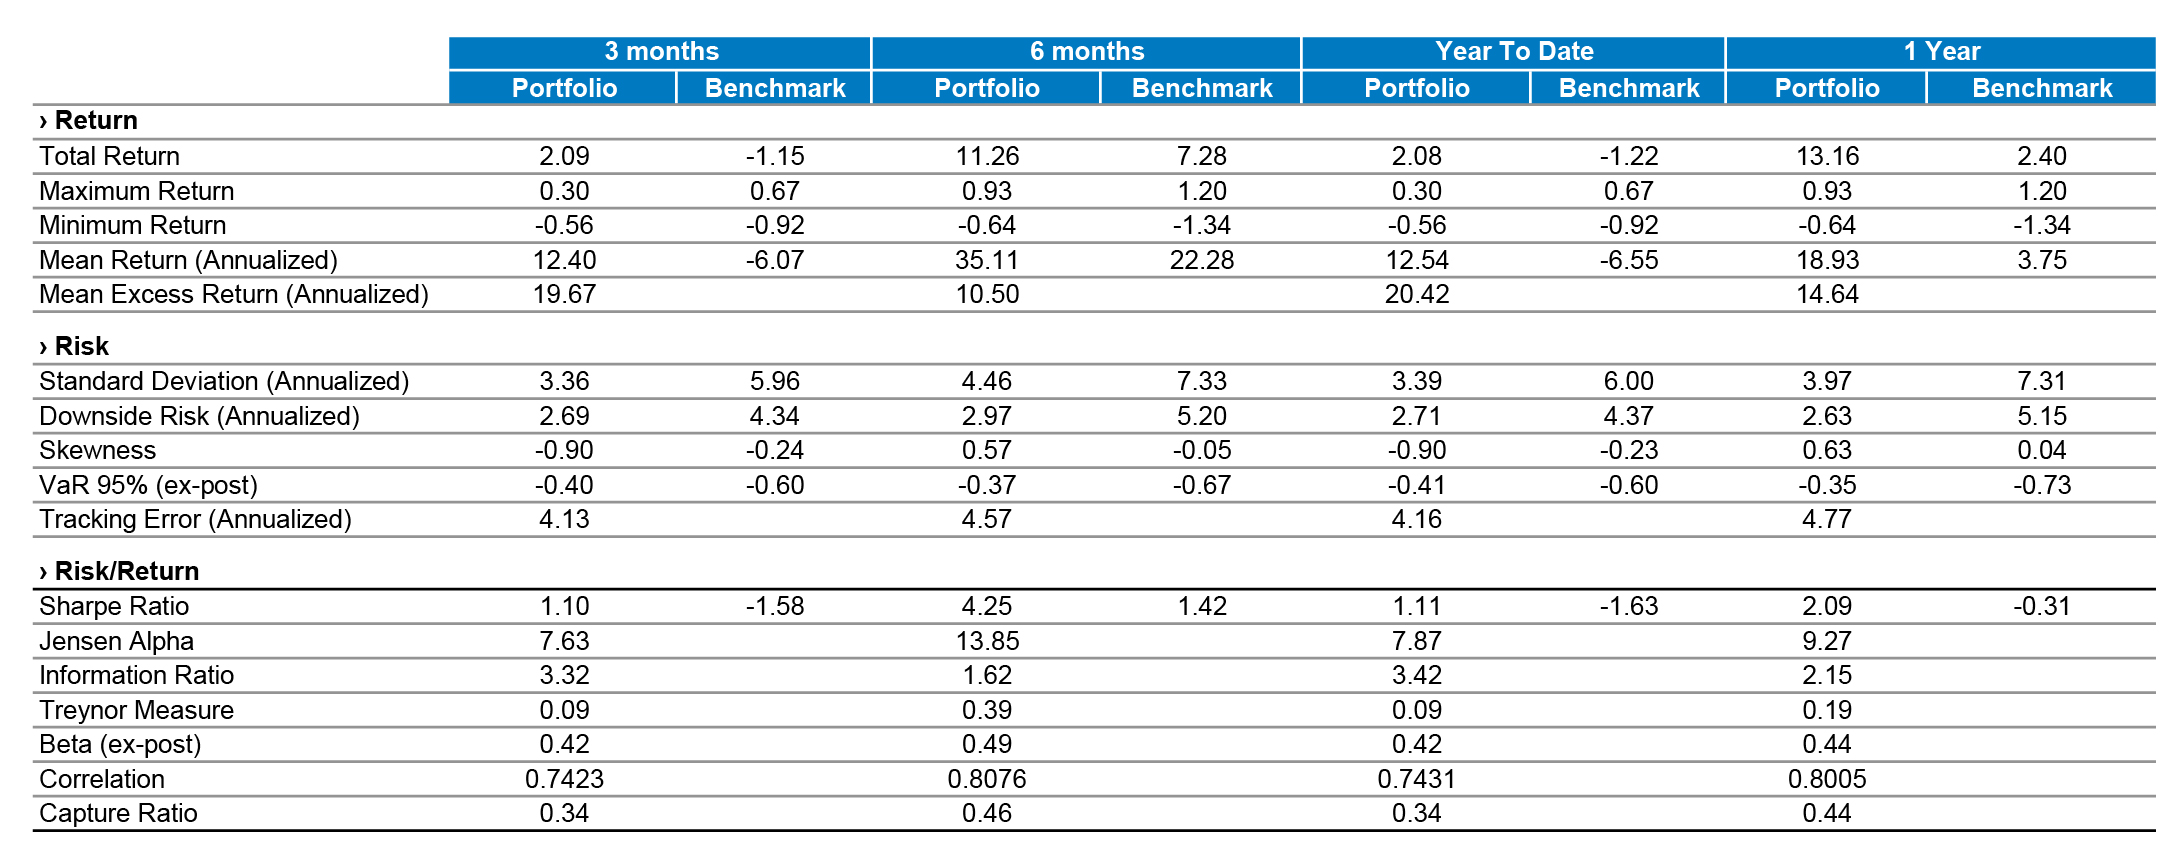
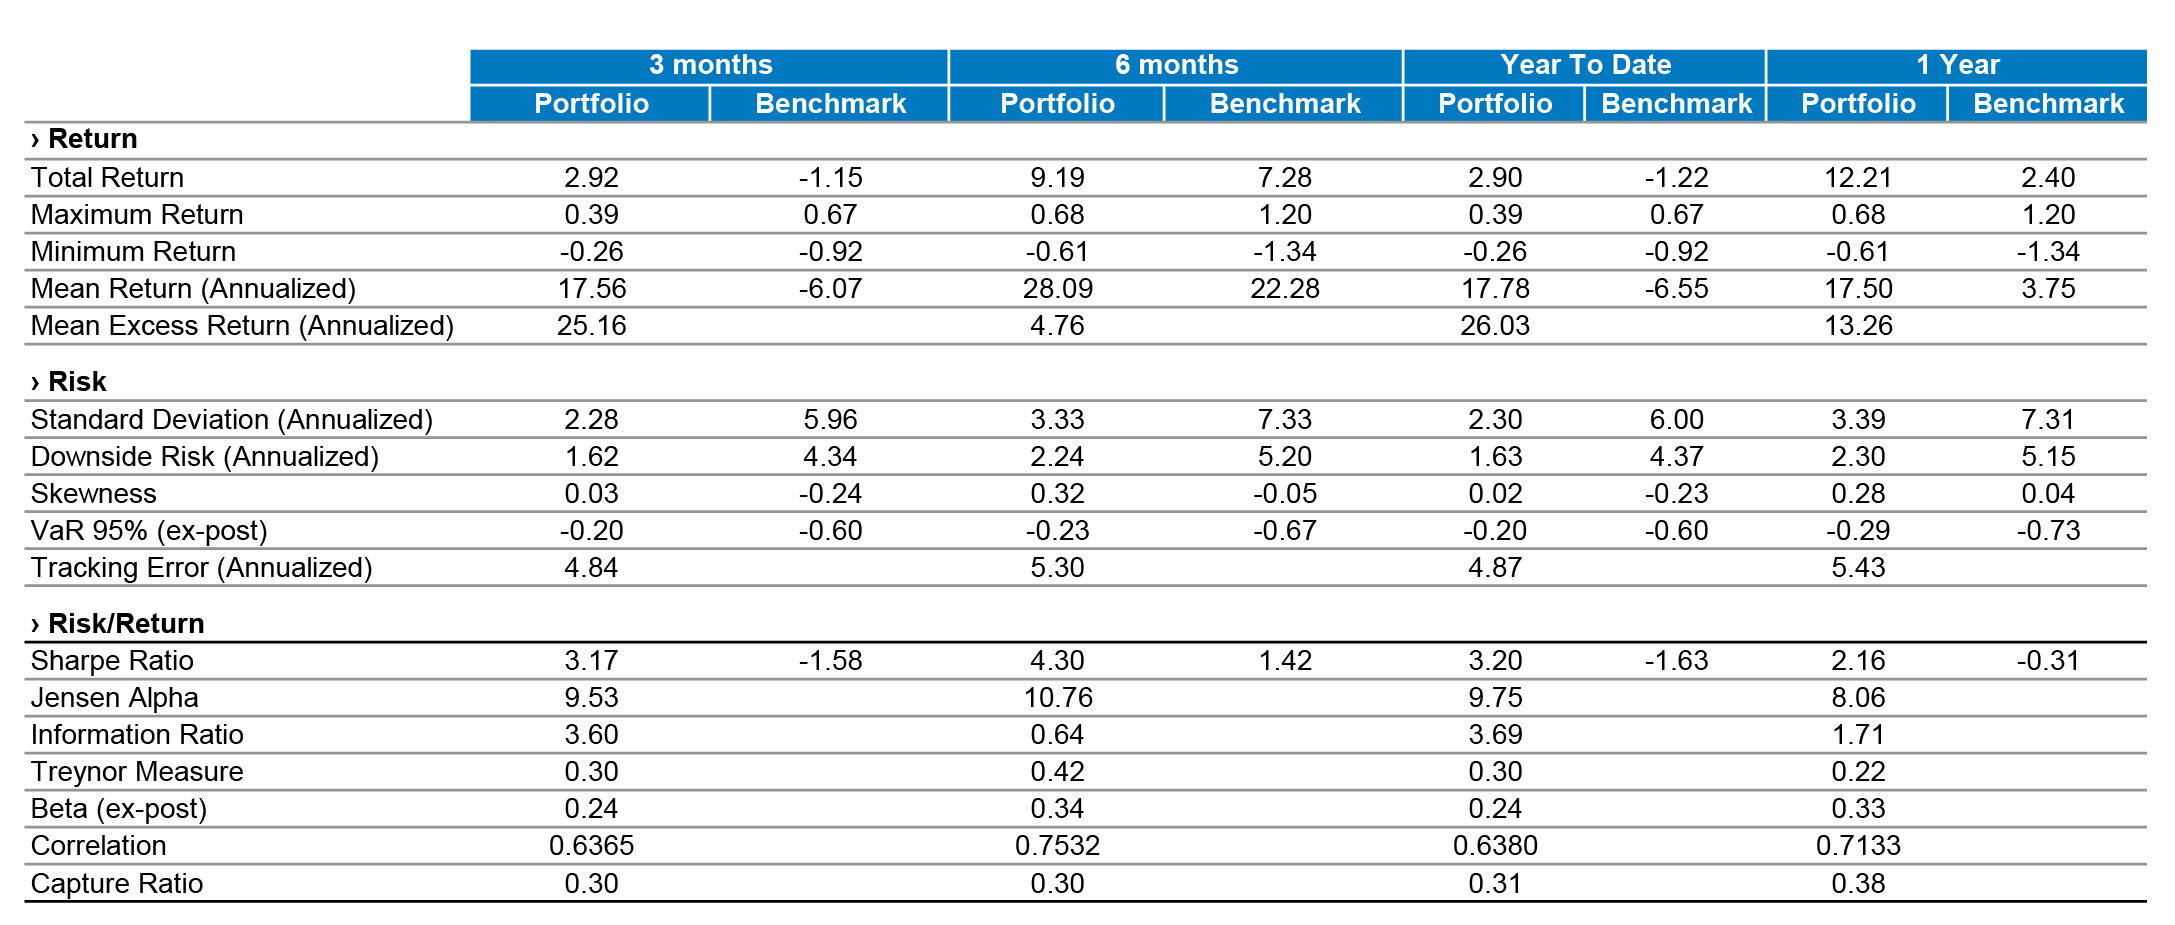
Using two simple models for illustrative purposes, one accenting credit quality and the other accenting yield, we can see how performance metrics complement core bond exposures, using the FTSE Canadian Aggregate Bond Universe as a reference.
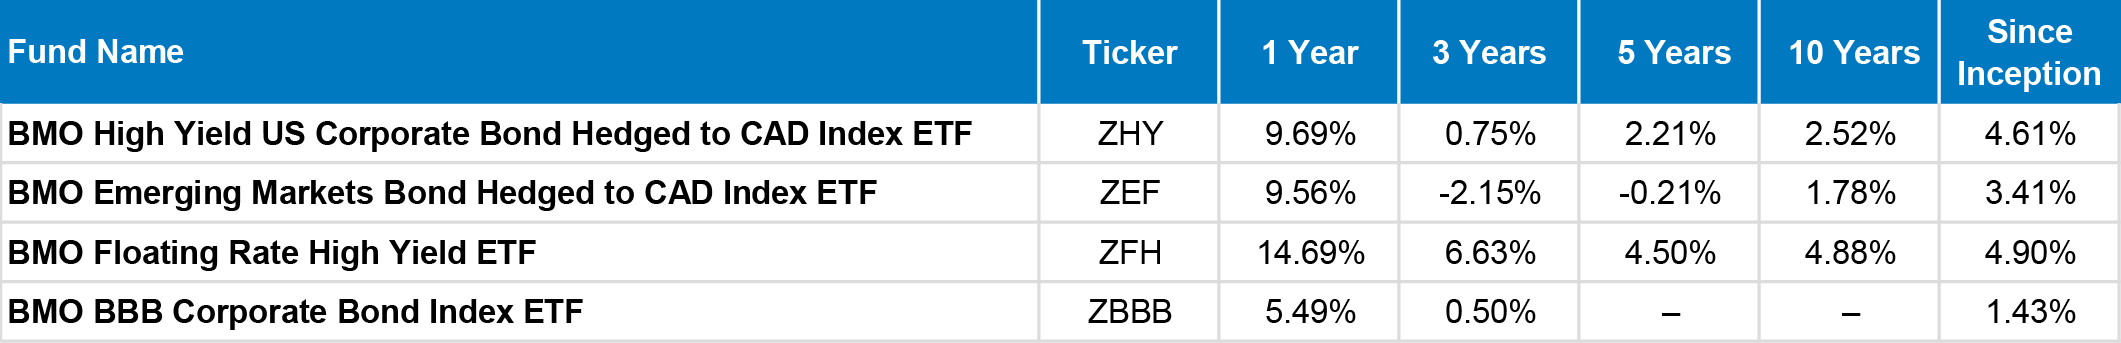
Our simple models use four ETFs:
- ZBBB: Canadian BBB-rated corporate bonds (to manage credit quality);
- ZEF: Debt-to-GDP weighted emerging market bonds, Hedged to CAD (2/3rds investment grade);
- ZFH: Floating rate high yield (synthetic exposure provides deep liquidity);
- ZHY: U.S. high yield.
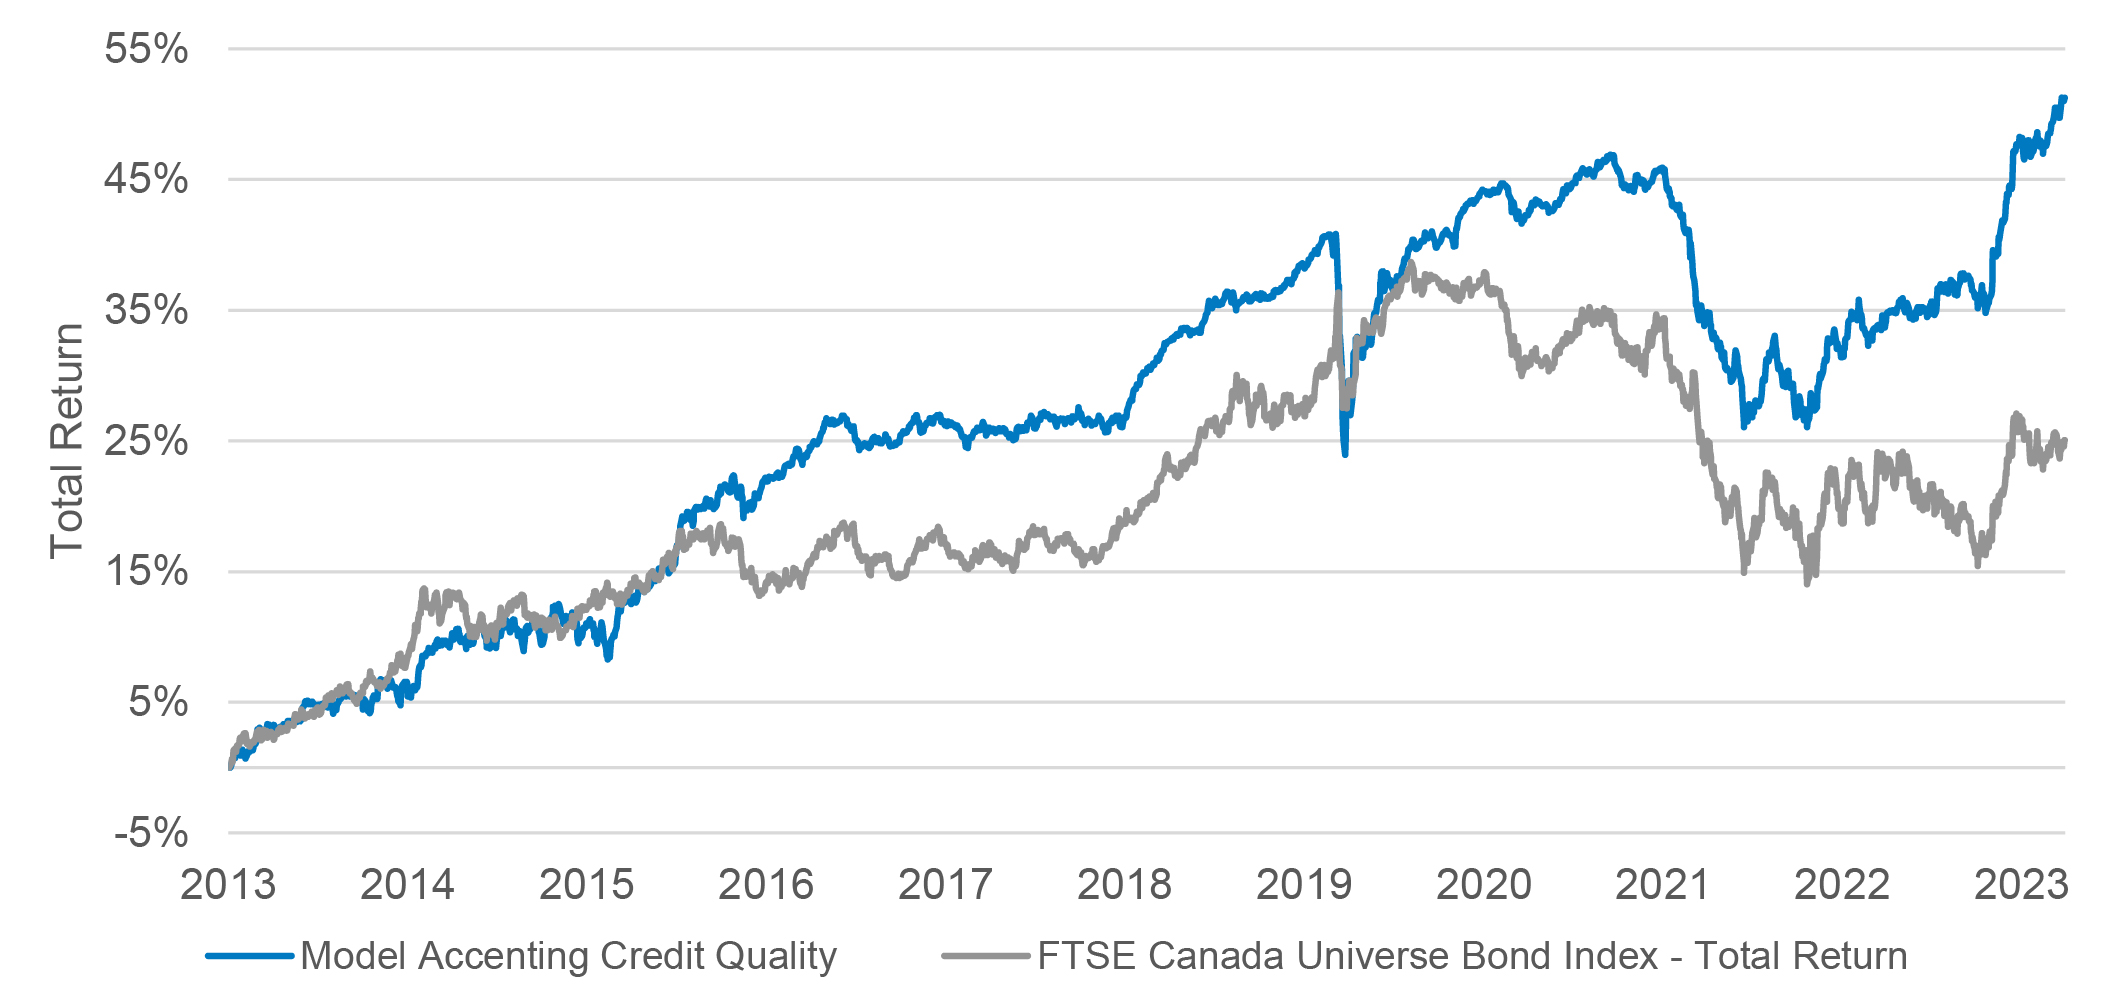
1. Model accenting credit quality:
- ZBBB & ZEF: 30% each
- ZFH & ZHY: 20% each
- BM: FTSE Canada Universe Bond Index – Total Return
- Rebalancing Frequency: Monthly
Source: Bloomberg, as of March 28, 2024. Returns are gross of fees and taxes. Past Performance is not indicative of future results.
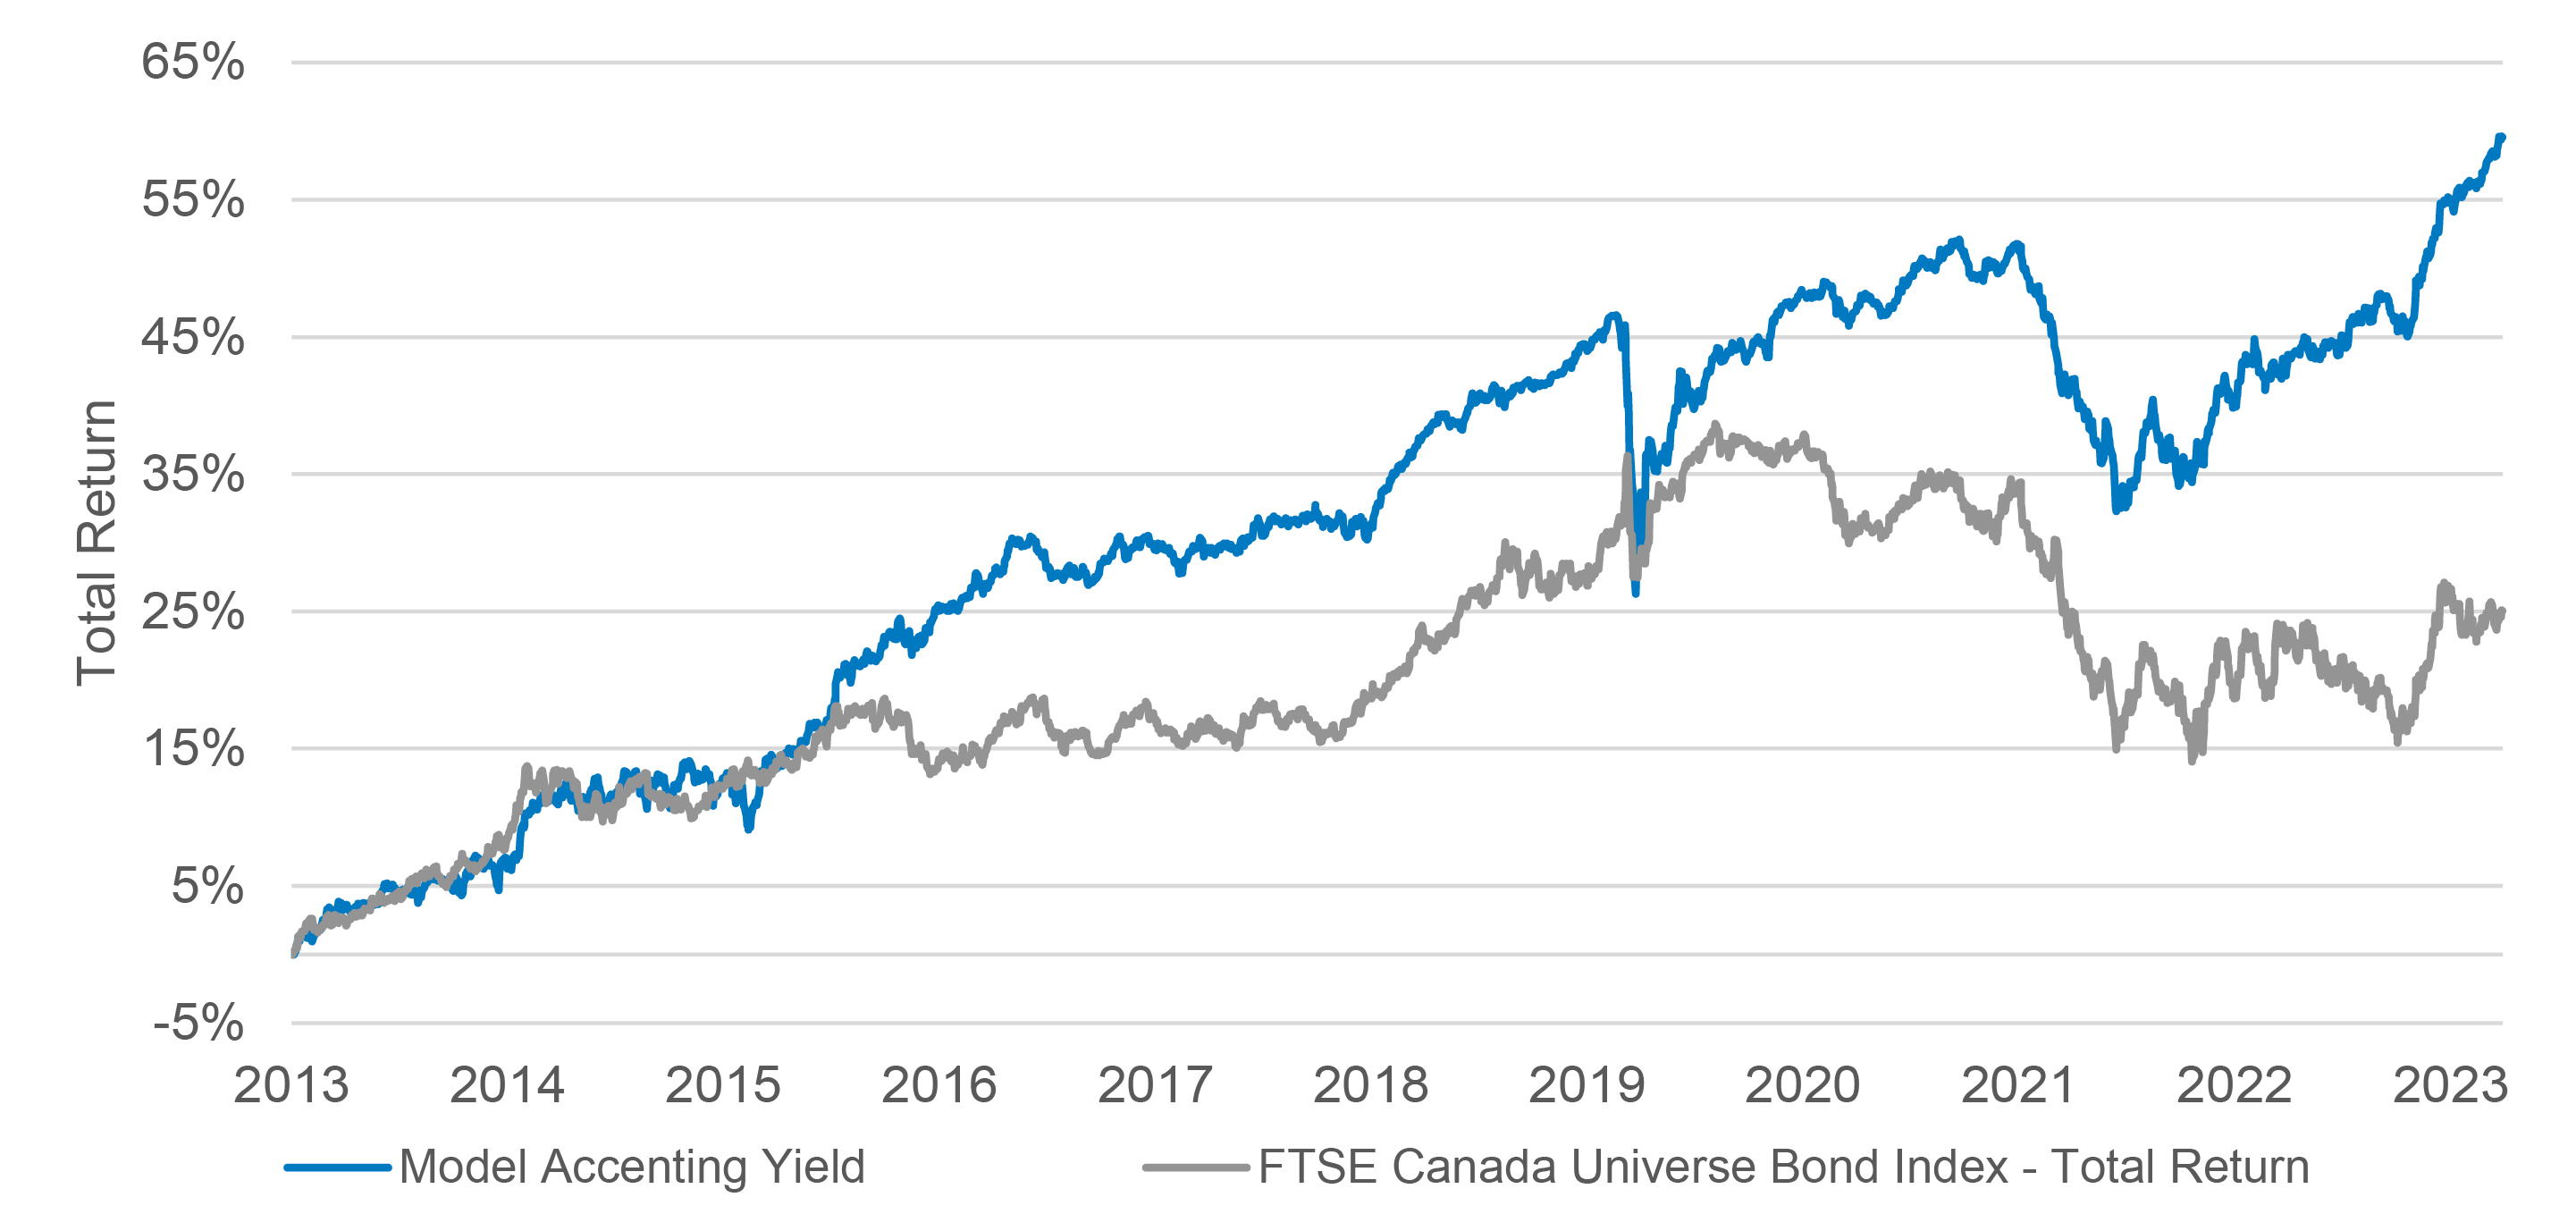
2. Model accenting yield:
- ZFH & ZHY: 30% each
- ZBBB & ZEF: 20% each
- BM: FTSE Canada Universe Bond Index – Total Return
- Rebalancing Frequency: Monthly
Source: Bloomberg, as of March 28, 2024. Returns are gross of fees and taxes. Past Performance is not indicative of future results.
The exposure and return profiles show considerable diversification to core fixed income. In contrast to private debt, these exposures provide liquidity daily, in and out, and carry fractional management costs.
Conclusion
Private assets are valuable additions to institutional portfolios, but they can, at times, pose significant operational constraints which may restrict a total portfolio approach. When the Denominator Effect comes knocking, their illiquidity impedes a dynamic solution.
Moving some private risk assets from unlisted to listed markets, from the denominator to the numerator, may broaden the data set, increase liquidity and capacity and reduce costs.
If you believe publicly listed assets can help to implement a total portfolio approach, bringing more data and more flexibility to the equation, the biggest decision is how much to allocate to liquid, public assets to complement your true private markets?
To offer constructive benefits, the allocation should be meaningful, though it will vary from one plan to another. Some of the most obvious guidelines will be plan maturity, solvency, governance structure and resourcing.
Just as private markets allocations vary widely by plan size and resources, so too should the application of liquid publicly listed proxies. It is not a case of one solution being better than another; they are different and complementary approaches with their own benefits and limitations, but it is our belief that in the Artful Dodger’s hands, pension plans can exert more control by making the case of an allocation to publicly listed assets to mimic private asset returns.
Footnotes
1 Core: an indirect exposure which may be economically sensitive and open to competition, e.g.: railways and other service providers; Broad: related businesses which may be economically sensitive and open to competition, e.g.: construction and communications; Pure-Play: display the highest similarity to unlisted Infrastructure. Direct ownership and operation of infrastructure assets producing cash flows.↩
Not intended for distribution outside of Canada.
The viewpoints expressed by the author represents their assessment of the markets at the time of publication. Those views are subject to change without notice at any time. The information provided herein does not constitute a solicitation of an offer to buy, or an offer to sell securities nor should the information be relied upon as investment advice. Past performance is no guarantee of future results. This communication is intended for informational purposes only.
Certain of the products and services offered under the brand name BMO Global Asset Management are designed specifically for various categories of investors in a number of different countries and regions and may not be available to all investors. Products and services are only offered to such investors in those countries and regions in accordance with applicable laws and regulations.
This communication is intended for informational purposes only and is not, and should not be construed as, investment, legal or tax advice to any individual. Particular investments and/or trading strategies should be evaluated relative to each individual’s circumstances. Individuals should seek the advice of professionals, as appropriate, regarding any particular investment. Past performance does not guarantee future results.
Any statement that necessarily depends on future events may be a forward-looking statement. Forward-looking statements are not guarantees of performance. They involve risks, uncertainties and assumptions. Although such statements are based on assumptions that are believed to be reasonable, there can be no assurance that actual results will not differ materially from expectations. Investors are cautioned not to rely unduly on any forward-looking statements. In connection with any forward-looking statements, investors should carefully consider the areas of risk described in the most recent simplified prospectus.
All figures and statements are as of month end unless otherwise indicated. Performance is calculated before the deduction of management fees. Past performance is no guarantee of future results.
Commissions, management fees and expenses all may be associated with investments in exchange traded funds. Please read the ETF Facts or prospectus of the BMO ETFs before investing. The indicated rates of return are the historical annual compounded total returns including changes in unit value and reinvestment of all dividends or distributions and do not take into account sales, redemption, distribution or optional charges or income taxes payable by any unitholder that would have reduced returns. Exchange traded funds are not guaranteed, their values change frequently and past performance may not be repeated.
For a summary of the risks of an investment in the BMO ETFs, please see the specific risks set out in the BMO ETF’s prospectus. BMO ETFs trade like stocks, fluctuate in market value and may trade at a discount to their net asset value, which may increase the risk of loss. Distributions are not guaranteed and are subject to change and/or elimination.
BMO ETFs are managed by BMO Asset Management Inc., which is an investment fund manager and a portfolio manager, and a separate legal entity from Bank of Montreal.
BMO Global Asset Management is a brand name under which BMO Asset Management Inc. and BMO Investments Inc. operate.
®/™Registered trademarks/trademark of Bank of Montreal, used under licence.
Mark Webster, Director, ETF Distribution, Institutional Sales & Service, Western Canda, BMO Global Asset Management

Mark is the BMO ETF team's representative for Western Canada. With over 30 years of experience in the financial services industry, Mark has covered many diverse forms of financial risk. He began his career as a professional indemnity broker, becoming a vice president at Minet International Professional Indemnity Ltd. (now part of AON), conducting risk analysis for the Big 8 global accounting firms, as well as some of the top U.S. law firms. He is responsible for overseeing the proliferation of ETFs throughout Canada's vast western region and providing support to portfolio managers from the Pacific (Duncan B.C.), to the Lakehead (Thunder Bay, Ontario). He has worked as a retail investment advisor with RBC DS; in the mutual fund industry with First Trust Portfolios; and has held several other positions in the pension industry. He brings with him a Master's degree in Russian History from McGill University and several CSI accreditations.