Articles of Interest
The low volatility effect –protecting portfolios during inflationary environments and recessions
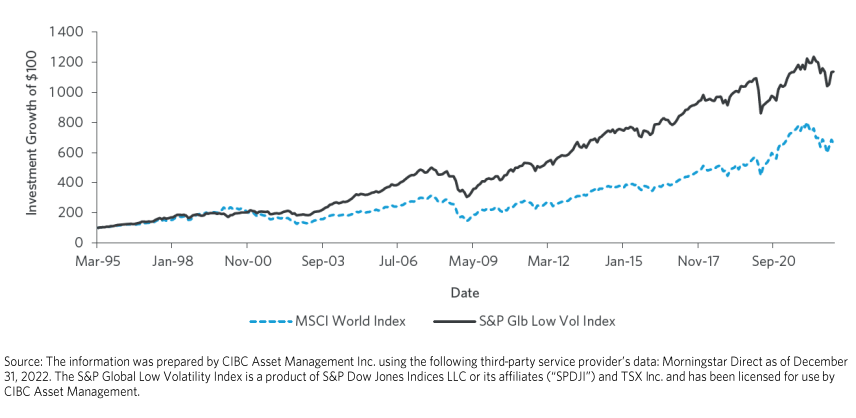
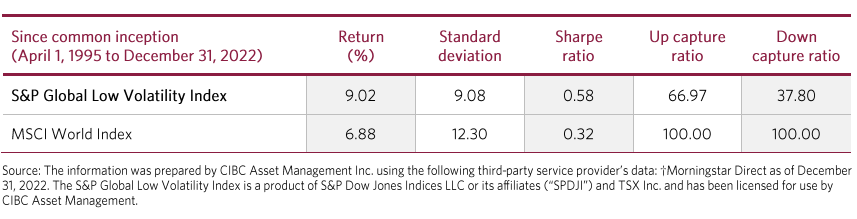
Over the long term, low volatility portfolios outperform the market on a risk-adjusted basis, with less volatility, while protecting on the downside.
Given the potential for a soft or hard landing in most developed markets globally, and with inflation at its highest since the 1980s, it’s important to assess how low volatility investments perform in these types of market environments. We’ll illustrate how low volatility portfolios outperform during inflationary environments and show how they outperform in both slowdown phases and recessions with higher risk-adjusted returns in all applicable market environments.
Index investment growth since common inception (April 1, 1995 to December 31, 2022)
Evaluating low volatility over multiple economic environments
Although the MSCI World Index is a well-established benchmark, its history is limited. We want to capture multiple economic environments and leverage performance data from the Kenneth French data library. The monthly returns encompass a much longer track record, starting in July 1963. This allows the research to include the high inflation periods of the 1970s and 1980s and several severe recessions.
Of particular focus for the factor research conducted was both the variance of returns and beta. In global markets, these two factors can be used interchangeably as a proxy for low volatility. However, the Quantitative Research team at CIBC Asset Management tends to prefer the use of variance. Beta can sometimes be artificially lower because of correlations between a stock and the market. For instance, gold stocks tend to have a lower beta compared to the S&P/TSX Composite Index, not because they exhibit lower volatility, but because of their low correlation with the market. That doesn’t really mean they’re low volatility stocks. In fact, they can often exhibit high volatility so this research aims to use variance instead.
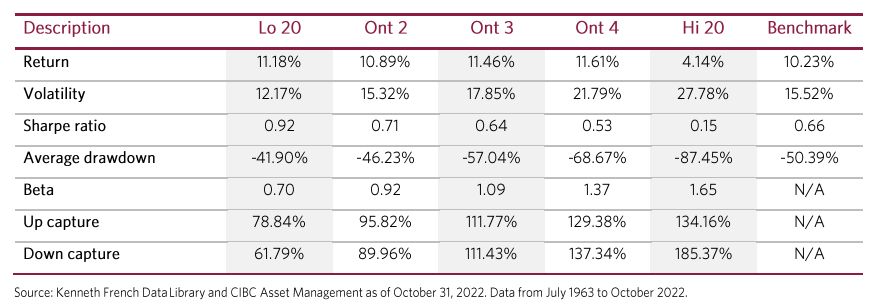
The methodology throughout this paper uses 60-day variance, excluding IPOs, of all NYSE, AMEX and NASDAQ stocks with no survivorship bias from July 1963 to October 31, 2022 referenced as the US Fama-French investable universe. To construct the factor, the universe of stocks was sectioned into five quintiles. The stocks that exhibited the lowest variance are in the lowest quintile. The analysis focused on the US market as it has the longest available performance history. Variance is the square of volatility, and the two measures can be used interchangeably for defining portfolio rankings.
For benchmark purposes, we used the market-cap weighted US Fama-French investable universe as a market proxy, which includes dividends. In our analysis, it will be termed either benchmark or market throughout this paper.
The conclusions using this form of analysis yield a very similar result to the first section of this paper. Throughout all market environments from July 1963 to October 2022, the lowest quintile stocks have the highest risk-adjusted returns, lowest volatility, and beta which suggests a smoother investment experience.
Low volatility outperforms during inflationary period
The Consumer Price Index (CPI) is one of the most common measures of inflation. It is the price of a weighted average market basket of consumer goods and services purchased by households. Changes in measured CPI track changes in prices over time and are a way to monitor the level of inflation.
Henry Neville, author of The Best Strategies for Inflationary Times and winner of the prestigious 2022 Bernstein Fabozzi/Jacobs Levy Best Article Award, defines inflationary regimes as:
“We define inflationary regimes when the inflation rate rises “materially beyond 2%” as reaching 5% or more. We define the regime end as the point at which CPI year over year reaches its peak without having fallen below 50% of its maximum annual rate in rolling 24-month observation windows. Using this observation window allows for the inflation rate to be volatile at a high level but to make successive higher highs without ending an inflationary episode. Alternatively, a new episodeis determined to have started when inflation is already above 2% but has fallen to less than 50% of its trailing 24-month peak rate, and then starts to re-accelerate, as long as it reaches a faster inflation rate than 5%. Lastly, episodes shorter than sixmonths were excluded for being too short to constitute a regime change.”
Neville’s acclaimed definition for inflationary cycles was incorporated into our subsequent analysis of the Fama-French Variance factor returns. Upon review, there were six distinctinflationary scenarios that have occurred since 1963.
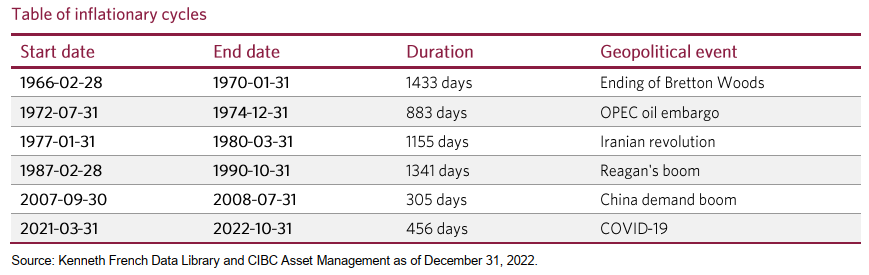
All of these events and inflationary cycles have been divided into the five distinct quintiles previously mentioned in the second section of this research paper.
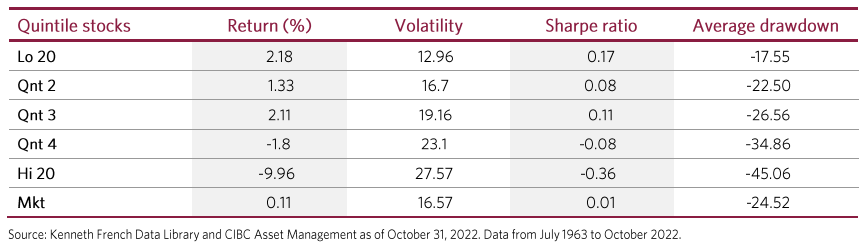
Performance during inflationary periods
The performance of low volatility stocks during inflationary periods had the highest absolute and risk-adjusted returns, and the lowest volatility and average drawdown.
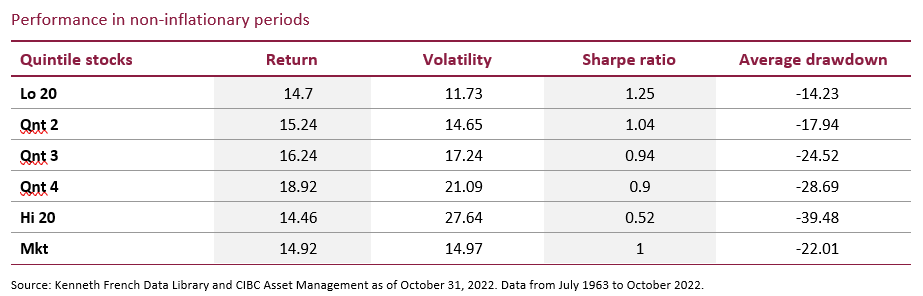
The performance of low volatility stocks in non-inflationary periods was still compelling. Though absolute underperformance was observed in comparison to some quintiles, low volatility had the highest risk-adjusted returns, the lowest volatility, and the smallest average drawdown when compared to both the market and other quintiles.
Overall, low volatility has the highest risk-adjusted returns in both inflationary and non-inflationary environments but tends to outperform in inflationary environments. Today, many investors are looking for a solution to protect against oneof the largest inflationary cycles in market history. Low volatility portfolios have the ability to outperform on both an absolute and risk-adjusted basis in this type of market environment. We believe low volatility portfolios can be a compelling solution because of its track record over the last 65 years.
Low volatility outperforms during economic slowdowns and recessions
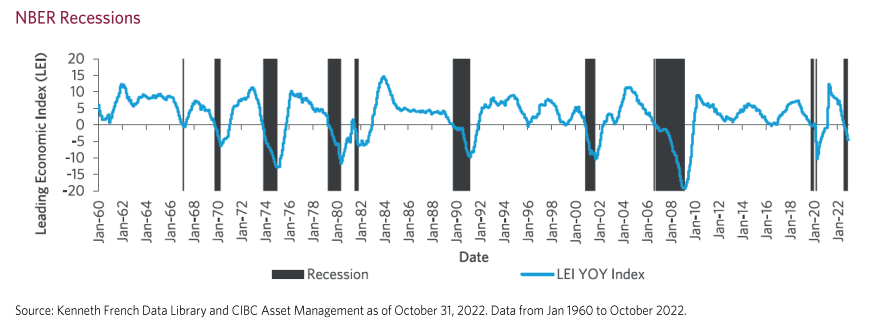
The Conference Board Leading Economic Index® (LEI) is a gauge that uses leading economic indexes designed to signal peaks and lows in the business cycle for the US economy. The index is constructed to summarize and reveal common turning points in the economy in a clearer and more convincing manner than any individual component. LEI includes components such as average weekly hours in manufacturing, interest rate spread, average initial claims for unemployment insurance, average consumer expectations, building permits, etc. LEI has a high correlation with gross domestic product (GDP). LEI is a predictive variable that leads turning points in the business cycle by approximately seven months. We can define four scenarios based on the LEI that indicate if the economy is in an expansion, contraction, recession or recovery phase.
- Recession: LEI year over year is less than 0, and LEI year-over-year is contracting
- Recovery: LEI year over year is less than 0, and LEI year-over-year is growing
- Expansion: LEI year over year is greater than 0, and LEI year-over-year is growing
- Slowdown: LEI year over year is greater than 0, and LEI year-over-year is contracting
The LEI business cycle indicator has a very consistent ability to track regimes dating back to the early 1960s.
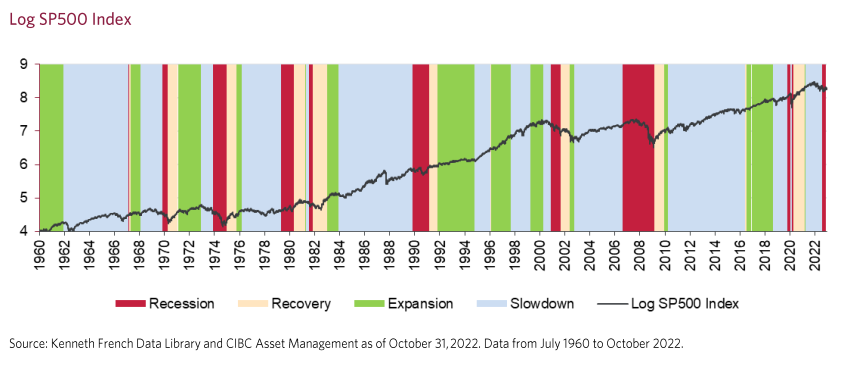
We divided the variance factor returns within the LEI business cycle methodology to determine how low volatility portfolios performed in each of the various four business cycles.


During a recession, low volatility outperforms all other quintiles including the benchmark. Low volatility also offered a smaller average drawdown and lower volatility. The Sharpe Ratio isn’t a reliable statistic in market drawdowns, so it was ignored for this business cycle phase. When compared to the market, low volatility cut the drawdown by almost half. This confirms its resiliency and the downside protection provided by low volatility investing.
Throughout slowdown periods, low volatility outperformedthe market, and underperformed versus some of the other quintiles. It also had the best risk-adjusted returns, lowest volatility and shallowest average drawdown.
During the recovery and expansionary periods, low volatility underperformed some or all otherquintiles, but was the best performer from a risk-adjusted perspective. The more volatility or beta exposure a portfolio has during the recovery phase, the better it performed. The recovery phase is the shortest of the four phases and is characterized by low-quality rallies.
During an expansionary period, the range of market returns appear fairly wide and low volatility typically underperforms. One of the common misconceptions associated with low volatility portfolios is they don’t add value to portfoliosbecause they underperform in up-markets. From a risk-adjusted perspective, low volatility portfolios significantly outperform. This is why it’s important to remember that low volatility strategies can enhance returns and provide a smoother overall investment experience despite underperforming during expansionary periods.
Overall, low volatility appears to perform best in market slowdowns and recessions. During all market cycles (where applicable), it has the highest risk-adjusted returns, lower volatility,and shallower drawdowns. We currently believe there is a:
- 60% chance of entering into a hard landing recession
- 30% chance of entering into a soft landing
- 10% chance of financial instability
If market volatility and recessionary conditions continue, a lowvolatility investment solution may be a prudent choice given its ability to outperform in this part of the business cycle.
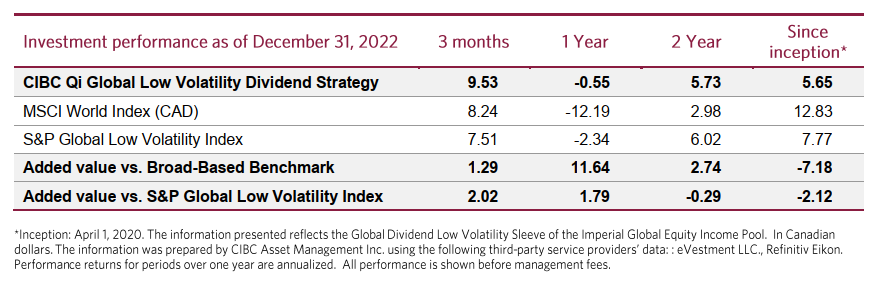
Considering the CIBC QiGlobal Low Volatility Dividend Strategy as a complement within a portfolio
Given the benefits outlined as towhy an investor should gain exposure to a low volatility portfolio in inflationary environments, slowdowns or recessions, the CIBC QiGlobal Low Volatility Dividend Strategy should be considered. It uses a quantitative approach that uses robust research, and strong risk management to enhance investment decision making and drive superior risk-adjusted returns. The strategy combines the benefits of quantitative modelling, and oversight of dedicated portfolio managers to improve client outcomes.
The CIBC Quantitative Research team manages the above strategy. They leverage their over 50 years of combined experience in investment management as well as mathematics, statistics, and computer science to construct strategies that act on empirical evidence and not emotion. The team screens out non-dividend payers to improve yield and total return, and take the lowest volatility stocks to provide downside protection with a smoother return profile.
The strategy's 2022 performance is important to highlight. The year was considered the start of one of the most significant inflationary cycles in history, an economic slowdown, with one of the most telegraphed recessions likely to be experienced in 2023. In this environment, the CIBC Qi Global Low Volatility Dividend Strategy outperformed significantly.
Given the potential for an economic slowdown throughout 2023 and continued forecasts of elevated inflation, we believe this mandate can provide continued protection in the current market environment. Funding a low volatility allocation can come from an existing equity or fixed income allocation. In the below example, there are three different portfolio scenarios:
- 50% MSCI World Index / 50% Bloomberg Global Aggregate Bond Index
- 50% MSCI World / 25% S&P Global Low Volatility Index / 25% Bloomberg Global Aggregate Bond Index
- 25% MSCI World Index / 25% S&P Global Low Volatility Index / 50% Bloomberg Global Aggregate Bond Index
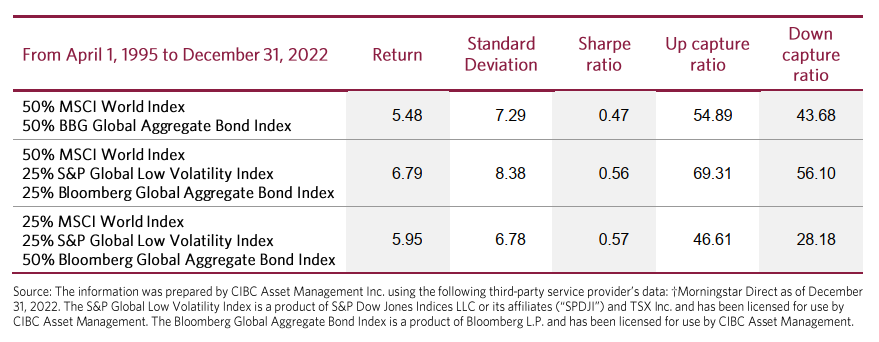
Funding from fixed income or equity increases the portfolio’s absolute and risk-adjusted returns. As a result, we believe a sound approach is to have meaningful weights in both traditional and low volatility exposures, using them as a complement given their varied return profiles and tendency to outperform at different times. Choosing portfolio allocations isn’t a black-and-white decision between market exposures or low volatility. It should incorporate both to help maximize favourable portfolio outcomes, especially throughout the continued market volatility we’re likely to experience throughout 2023.
Disclaimers
The views expressed in this document are the views of CIBC Asset Management Inc. and are subject to change at any time. CIBC Asset Management Inc. does not undertake any obligation or responsibility to update such opinions. This document is provided for general informational purposes only and does not constitute financial, investment, tax, legal or accounting advice nor does it constitute an offer or solicitation to buy or sell any securities referred to. Individual circumstances and current events are critical to sound investment planning; anyone wishing to act on this document should consult with his or her advisor. All opinions and estimates expressed in this document are as of the date of publication unless otherwise indicated, and are subject to change.
† 2023 Morningstar Research Inc. All Rights Reserved. The information contained herein: (1) is proprietary to Morningstar and/or its content providers; (2) may not be copied or distributed; and (3) is not warranted to be accurate, complete, or timely. Neither Morningstar nor its content providers are responsible for any damages or losses arising from any use of this information. Past performance is no guarantee of future results.
Certain information that we have provided to you may constitute “forward-looking” statements. These statements involve known and unknown risks, uncertainties and other factors that may cause the actual results or achievements of the securities to be materially different than the results, performance or achievements expressed or implied in the forward-looking statements.
The value of funds and portfolios change and past performance of funds, portfolios or strategies may not be repeated and is not indicative of future returns.
CIBC Asset Management and the CIBC logo are trademarks of Canadian Imperial Bank of Commerce (CIBC), used under license.
The material and/or its contents may not be reproduced without the express written consent of CIBC Asset Management Inc.
Peter Michaels, CFA, Senior Quantitative Analyst, CIBC Asset Management

Ryan Diamant, CFA, Associate Client Portfolio Manager – Equities, CIBC Asset Management

About CIBC Asset Management
At CIBC Asset Management, we believe every customized investment solution begins with research and rigour. We specialize in a variety of investment solutions such as equities, fixed income, currency management, liability-driven investments, asset allocation and responsible investments. Across a spectrum of investment solutions, we commit to best-in-class research. Dedicated sector and regional analysts focus on industry research and security-specific idea generation. Our investment professionals leverage deep and diverse expertise by sharing proprietary research across asset class teams. By sharing insight across asset class teams, we maximize opportunities to add value to our client portfolios. We provide our clients with our research insights and expertise on industry issues and themes that matter most to them.